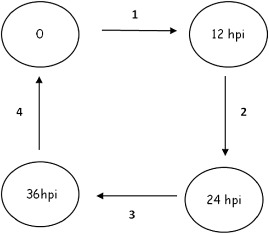
Figure 1.

Microarray slide hybridization layout. Loop design used in the 36‐h time course experiment. Circles represent samples of either AC (parent line) or OxO (transgenic line). Arrows represent microarray slides hybridized with samples at the arrowhead and tail. ‘0’ represents the mock‐inoculated T0 sample; hpi, hours post‐inoculation. Three independent biological replications were performed.
