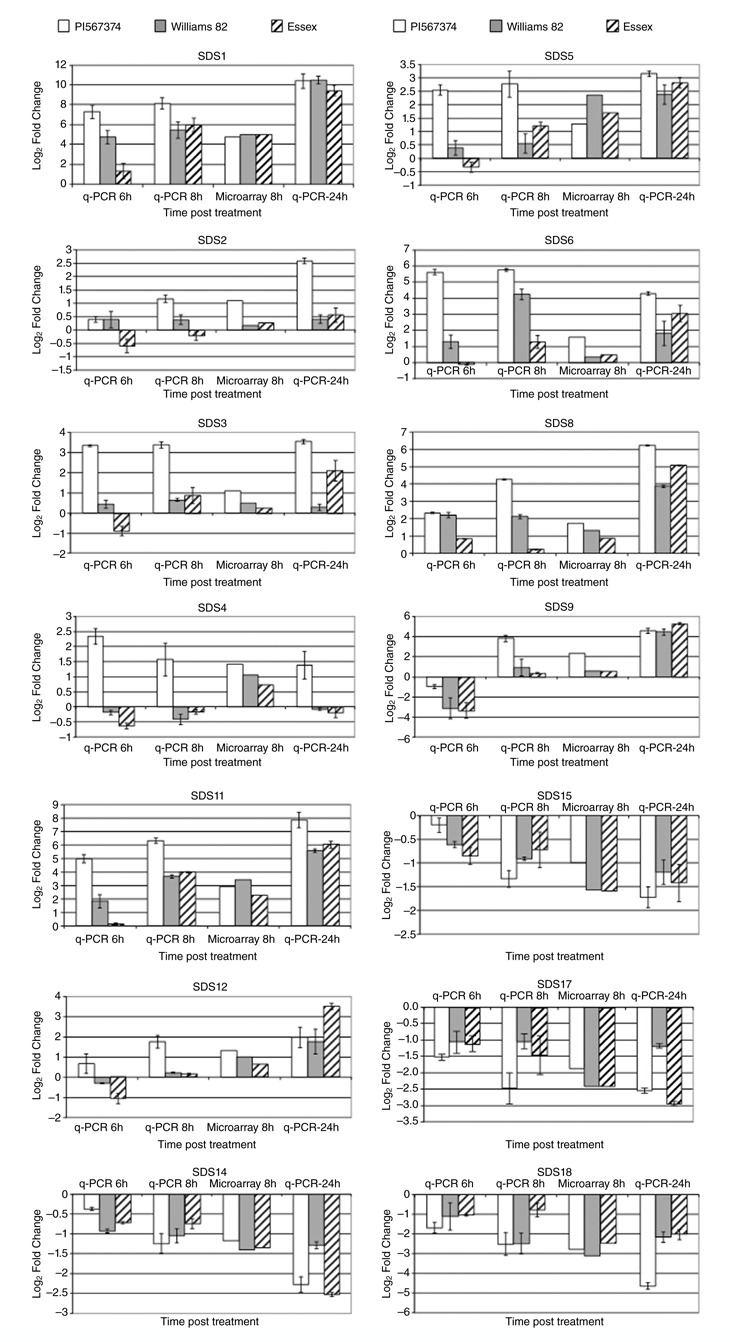
Figure 4.

Quantitative reverse transcriptase‐polymerase chain reaction (qRT‐PCR) confirmed the regulation of 14 genes from the microarray results. The expression profiles of these genes were determined by qRT‐PCR at 6, 8 and 24 h post‐treatment (hpt). Expression levels are given as the log2‐transformed fold change of Fusarium virguliforme phytotoxin (Fv toxin)‐treated soybeans compared with mock treatment. In each histogram of qRT‐PCR results, the means of three biological replicates are represented ± standard deviation (SD). Bars from left to right: white bars, PI567.374; grey bars, Williams 82; striped bars, Essex. The soybean actin gene was used as a reference control gene.
