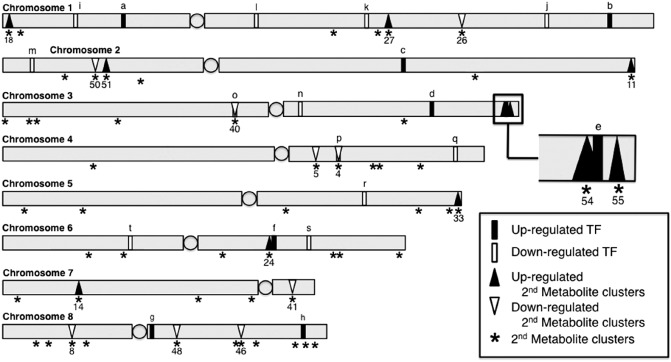
Figure 3.

The diagram illustrates the chromosomal location of the differentially expressed Aspergillus flavus transcription factors (TFs) (Table 1) and secondary metabolite gene clusters up‐ and down‐regulated (Table 2, up and down arrows) during maize kernel colonization. Up‐regulated TFs (map ID: a–h) are shown as filled vertical bars, and down‐regulated TFs (map ID: i–t) as open vertical bars. All 55 predicted secondary metabolite clusters are depicted on the map as asterisks (*) positioned under the grey chromosome bars. Centromeres are represented as shaded circles on each of the chromosomes. Up‐regulated secondary metabolite clusters and down‐regulated clusters are denoted by filled and open triangles, respectively. The aflatoxin regulator aflR (map ID: e) is found within cluster 54, TF AFLA_112830 (map ID: o) in cluster 40 and TF AFLA_005460 (map ID: p) is part of cluster 4.
