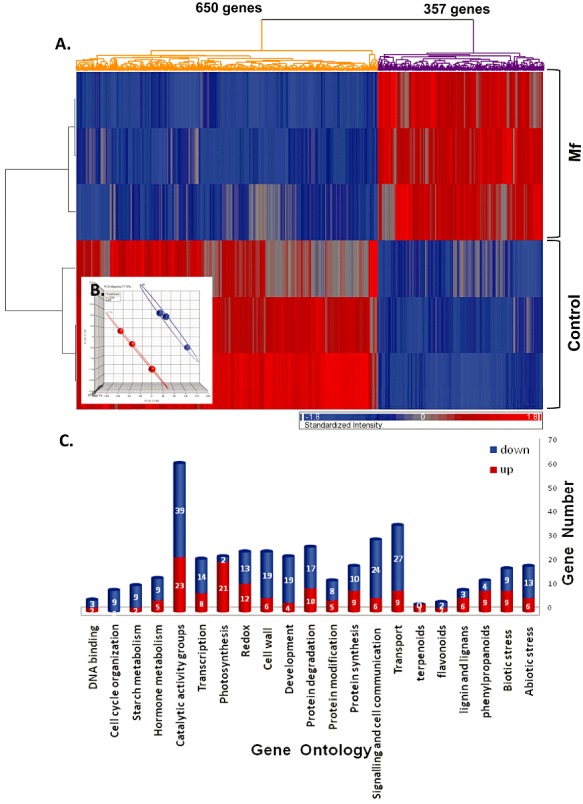
Figure 1.

(A) Hierarchical clustering of genes. Mf, Metschnikowia fructicola. (B) Principal component analysis (PCA) of the three yeast‐treated and three control arrays used in the experiment. (C) Functional analysis of microarray citrus probes. Genes for major functional categories (gene ontology) are shown; up‐regulated genes are coloured blue and down‐regulated genes are coloured red.
