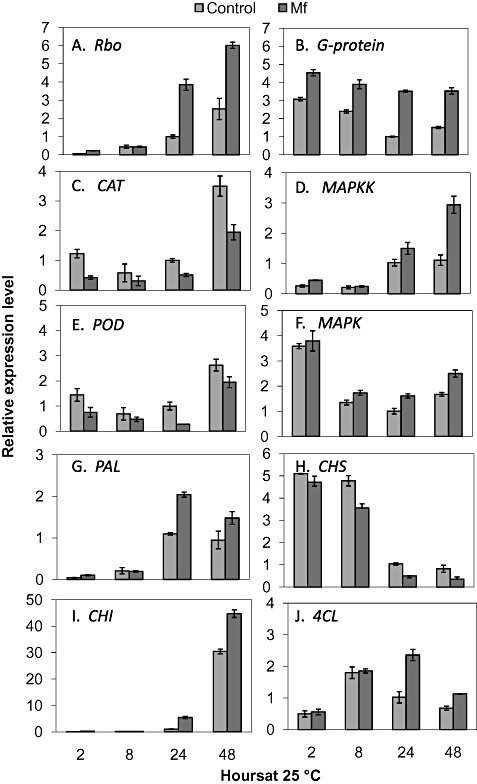
Figure 2.

Relative expression levels (transcript accumulation) determined by reverse transcription‐quantitative real‐time polymerase chain reaction (RT‐qPCR) of respiratory burst oxidase (Rbo, Cit.25134.1.S1_at) (A), G‐protein (Cit.35804.1.S1_at) (B), catalase (CAT, ABG49115) (C), mitogen‐activated protein kinase kinase (MAPKK, Cit.25223.1.S1_at) (D), peroxidase (POD, ABG49115) (E), mitogen‐activated protein kinase (MAPK, EF185418) (F), phenylalanine ammonia‐lyase 2 (PAL, AJ238753) (G), chalcone synthase 1 (CHS, AB009351) (H), chitinase I (CHI, AF090336.1) (I) and 4‐coumarate‐CoA ligase (4CL, Cit.11987.1.S1_s_at) (J) in Metschnikowia fructicola (Mf)‐ and water (control)‐treated grapefruit wounds. Values were normalized to the control at 24 h, arbitrarily set to unity. Vertical lines represent the standard error for an average of three biological replicates.
