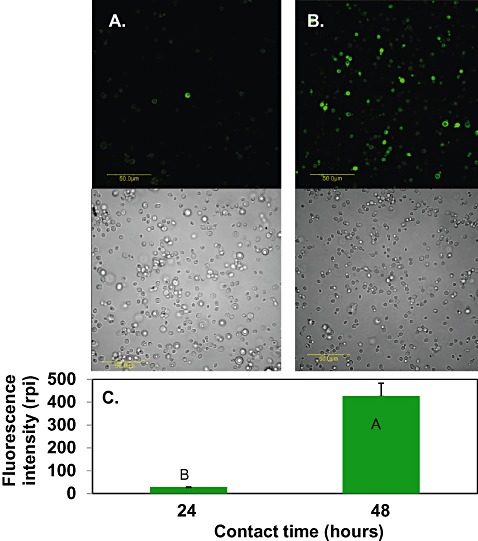
Figure 4.

Laser scanning confocal fluorescence images (top panel) of H2O2 accumulation in Metschnikowia fructicola cells, combined with bright field images (bottom panel). Yeast was grown in nutrient yeast dextrose broth (NYDB) for 24 h (A) or 48 h (B) at 25 °C. Scale bar, 50 µm. Quantification of H2O2 level in yeast cells, expressed as the relative pixel intensity (rpi) (C). Histograms represent the mean ± standard error (n= 6). Histograms with different letters indicate significant differences according to Tukey's test (P < 0.05).
