
Figure 1.
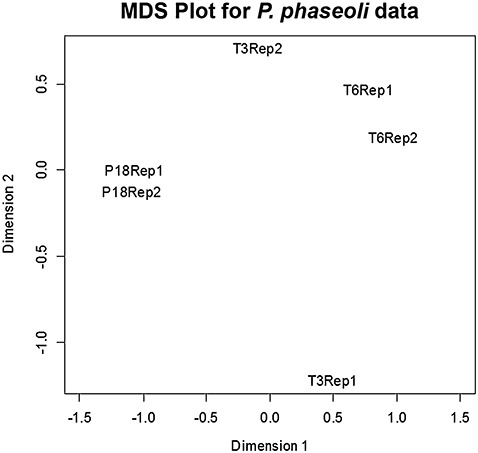
Multidimensional scaling (MDS) showing the relationship between replicates in two dimensions (dimensions 1 and 2), generated by edgeR. Two replicates (Rep1 and Rep2) for the samples P18 and T6 are closely related in both dimensions, whereas the T3 replicates are closely related in dimension 1 and separated in dimension 2. Axes x and y are representations of all the gene expression levels between groups based on tissue type and replicates.