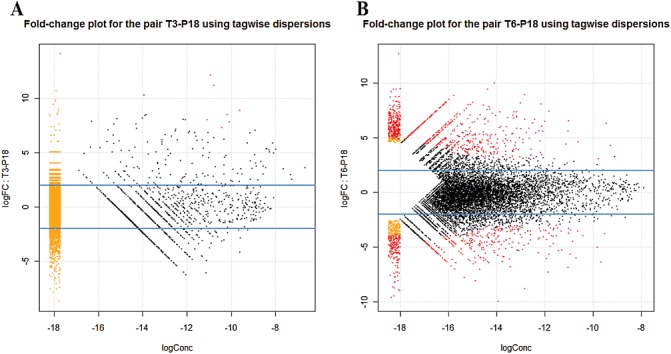
Figure 2.

Smear plot generated from edgeR showing the log fold change (FC) against the log concentration (Conc) (a summary measure of the average concentration for each tag over all treatment conditions) for each tag, using tagwise dispersion. The most differentially expressed tags are highlighted in red, showing eight for P18–T3 (A) and 1284 for P18–T6 (B). The smear of dots (orange and red) on the left side signifies that genes were observed in only groups of replicate samples.
