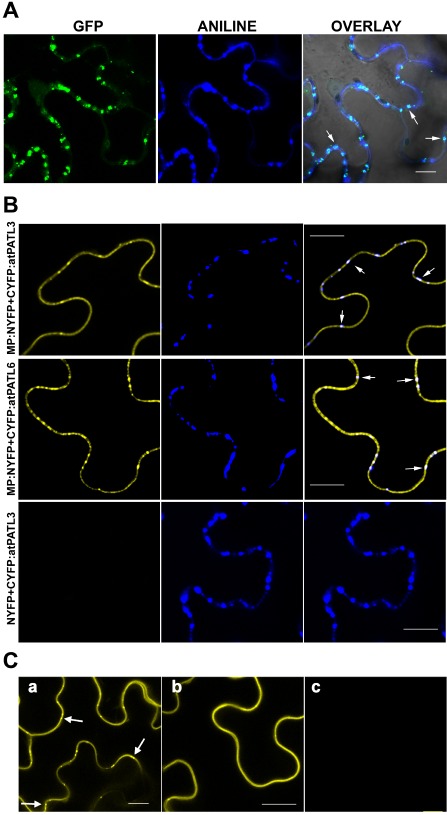
Figure 2.

Localization of Alfalfa mosaic virus (AMV) movement protein (MP) at plasmodesmata (PD) and bimolecular fluorescence complementation (BiFC) analysis of the MP–Patellin (MP–PATL) interactions. (A) Confocal laser scanning microscopy (CLSM) images of epidermal cells expressing MP:GFP [green fluorescent protein (GFP) panel] and stained with aniline blue (ANILINE panel) showing MP:GFP and callose localization, respectively. OVERLAY panel is the superposition of GFP, ANILINE and the corresponding bright field image. Arrows indicate PD labelled with both MP:GFP and aniline blue. (B) BiFC analysis to corroborate AMV MP–atPATL interaction in planta. CLSM images of epidermal cells co‐infiltrated with MP:NYFP and CYFP:atPATL3 or CYFP:atPATL6 (indicated on the left) and stained with aniline blue solution. Panels on the right are the superposition of the yellow fluorescent protein (YFP) fluorescence and Aniline staining images (panels on the left and centre, respectively). Arrows indicate reconstituted fluorescence co‐localizing with callose‐rich PD. Leaves infiltrated with NYFP and CYFP:atPATL3 are the negative interaction controls. (C) BiFC analysis to analyse the implication of the GOLD domain in the interaction between AMV MP and atPATL3. CLSM images of epidermal leaves co‐infiltrated with MP:NYFP and CYFP:atPATL3 (a), MP:NYFP and CYFP:atPATLP3‐ΔGOLD (b) or MP:NYFP and CYFP:GOLD‐P3 (c) are shown. Arrows indicate fluorescence spots representing PD. Bar, 10 μm.
