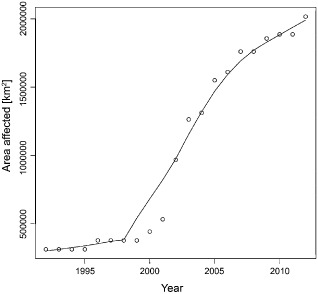
Figure 4.

Progress of ash dieback in Europe. The whole area of a country was added to the area affected by the disease in the year of the first report of the disease in that country. The year of the first report was according to fig. 1 in Timmermann et al. (2011). Curve was fitted using LOWESS (f = 0.4) (Cleveland, 1981).
