
Figure 2.
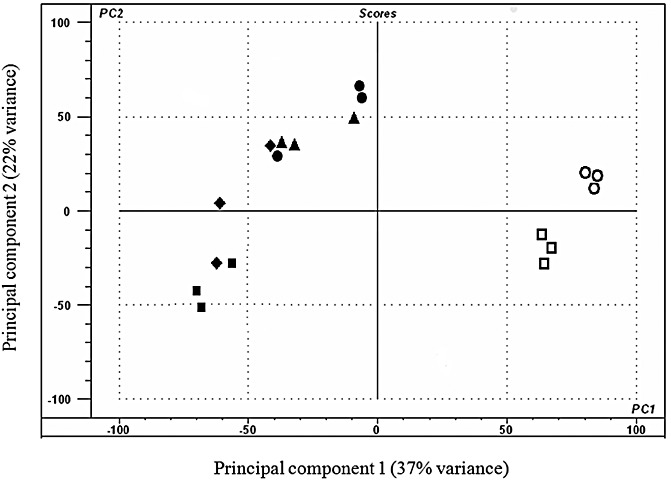
Principal component analysis of the expression profile from 18 sample datasets using The Unscrambler® software (CAMO, Oslo, Norway). The samples used consisted of materials in triplicate from detached leaf assays infected with Stagonospora nodorum SN15 [3 dpi in planta ( ), 5 dpi in planta (◆), 7 dpi in planta (●) and 10 dpi in planta (▴)] and axenically grown SN15 [4 dpi in vitro (
 ) and 16 dpi in vitro (
 )]. Principal component 1 (PC1) accounted for 37% of the variation and principal component 2 (PC2) described 22% of the variation. PC1 mainly differentiates samples according to the growth medium, whereas PC2 mainly differentiates samples according to their developmental stage. dpi, days post‐inoculation.