Figure 2.

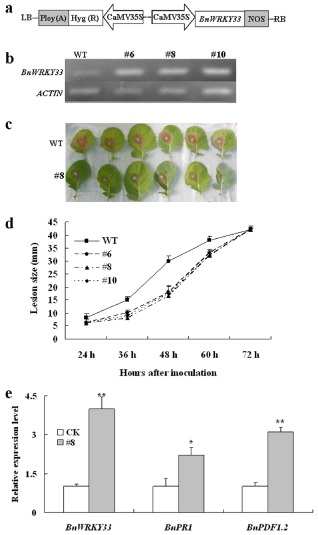
Characterization of BnWRKY33‐overexpressing lines. WT, untransformed wild‐type control; #6, #8 and #10, three independent BnWRKY33 transgenic T2 lines. (a) Diagram of the plasmids used in this study. CaMV35S, cauliflower mosaic virus 35S promoter; NOS, terminator. (b) Validation of BnWRKY33‐overexpressing lines at transcription levels revealed by reverse transcription‐polymerase chain reaction (RT‐PCR). (c) Disease responses of inoculated plants at 48 h post‐inoculation (hpi). Photographs were taken of leaves from three plants of WT and three hygromycin‐ and PCR‐positive plants of line 8. (d) Disease progression is shown from 24 to 72 hpi. Error bars indicate standard deviations. Differences in susceptibility between WT and the transgenic lines were significant (P < 0.05) from 36 to 60 hpi. (e) Relative expression levels of BnWRKY33, BnPDF1.2 and BnPR1 were quantified by real‐time qPCR. Values are means of three replicates. The error bars show the standard deviation. The significances of the gene expression differences between line 8 and WT (CK) are indicated: **(Student's t‐test, P > 0.01) or *(Student's t‐test, P > 0.05).
