Figure 5.

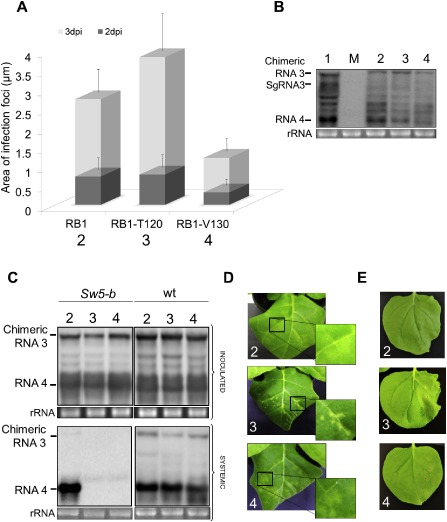
Functional characterization of NSm RB1 single mutants. (A) Histograms represent the average of the area of 50 independent infection foci at 2 and 3 days post‐inoculation (dpi) observed in Nicotiana tabacum P12 plants inoculated with transcripts from Alfalfa mosaic virus (AMV) RNA 3 pGFP/A255/CP derivatives pGFP/RB1:A44/CP (lane 2), pGFP/RB1‐T120:A44/CP (lane 3) and pGFP/RB1‐V130:A44/CP (lane 4). The fluorescent infection foci were visualized using a Leica stereoscopic microscope. Error bars indicate the standard deviation. (B) Northern blot analysis of the accumulation of chimeric AMV RNAs in P12 protoplasts inoculated with RNA transcripts derived from the constructs used in (A) plus the plasmid pGFP/A255/CP (lane 1). (C) Northern blot analysis of the accumulation of the chimeric AMV RNAs in N. tabacum plants that express constitutively the Sw5‐b gene (Nt/Sw5‐b) or N. tabacum wild‐type (Nt/wt) plants. All plants were inoculated as described in Fig. 3 in which the chimeric RNA 3 corresponds to the transcripts derived from the constructs pRB1:A44/CP (lane 2), pRB1‐T120:A44/CP (lane 3) and pRB1‐V130:A44/CP (lane 4). Total RNA was extracted from inoculated and upper leaves as described in Fig. 4. The positions of the chimeric RNA 3 and RNA 4 are indicated in the left margin of the photographs. (D) Symptomatology observed in Nt/Sw5‐b plants inoculated with chimeric AMV derivatives used in (C) at 6 dpi. (E) Photographs of Nb/Sw5‐b leaves expressing TSWV NSm RB1:HA (2), RB1‐T120:HA (3) and RB1‐V130:HA (4) at 6 days post‐agroinfiltration. Mock (M) represents total RNA extraction of healthy tissue. rRNA indicates 23S RNA loading control. HA, haemagglutinin; NRB, non‐resistance‐breaking; RB, resistance‐breaking.
