
Figure 5.
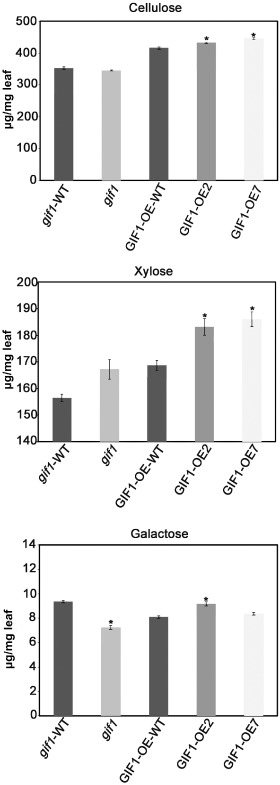
Levels of xylose, cellulose and galactose in leaf cell walls of the gif1 mutant, overexpression lines and wild‐types (WT) for gif1 (gif1‐WT) and overexpression line (GIF1‐OE‐WT). The data are given as means ± standard error (SE) (n = 3). *Significant difference in comparison with the WT control (P ≤ 0.01).