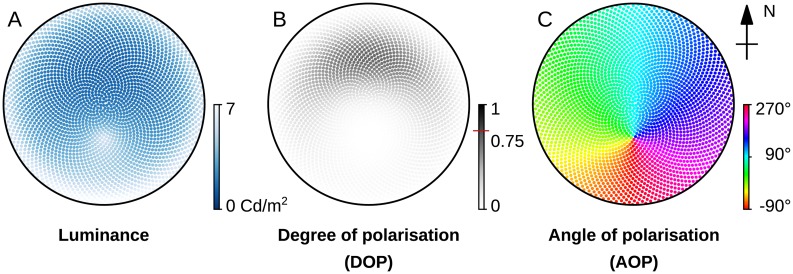
Fig 2. Sample output from the skylight dome model [44].
(A) The luminance pattern of the sky is proportional to its intensity and describes the amount of light per area unit existing in a specific direction. Along with the chromaticity coordinates, it can provide spectral information. (B) The degree of linear polarisation pattern in the sky based on the scattering of the light on atmospheric particles. It is defined by the fraction of the polarised portion over the total intensity. The red line on the colour-bar showing the d = 0.75 indicates the maximum DOP observed in the skylight simulation. (C) The angle of polarisation pattern in the sky is defined by the average e-vector (electric part of an electromagnetic wave) orientation of the photons. The black circle in the figures denotes the horizon. In all panels the sun position is 30° south.

