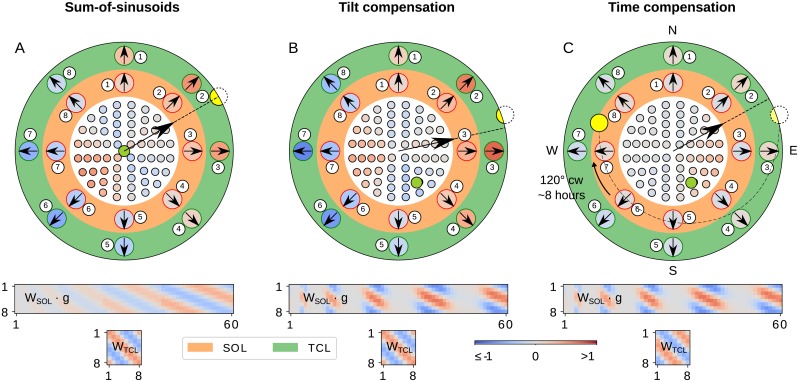
Fig 7. Step-by-step processing of the compass model.
The white, orange and green areas show the response of the POL-, SOL- and TCL-neurons respectively; red denotes excitation and blue suppression (see colour-bar for values). The set of synaptic weights connecting each layer is shown under the disc (values based on the same colour-bar). Orange background means that the activity is affected by the gating function, and green that it is affected by the time compensation mechanism. In the white disc, different points are the relative positions of the POL units on the sensor; the numbering starts from the centre and unwraps clockwise towards the outline like a spiral; the round green mark is the point of the sensor that is aligned with the zenith of the sky, and the yellow circle is the sun position. The black arrow with the dashed line is the decoded prediction of the solar azimuth from the TCL-neurons; the numbering refers to the identities of the neurons in weight matrices below. The weight matrices show the synaptic weight between consecutive layers [defined by Eqs (6) and (7) for the SOL and TCL respectively; values based on the same colour-bar]; the horizontal is the input and the vertical the output axis. (A) The sum-of-sinusoids mechanism detects the solar azimuth; the zenith (green) point is aligned with the sensor orientation; the solar azimuth is encoded in both the SOL- and TCL-layers and the activation code (i.e. phase) of the two layers look identical, as the time compensation mechanism has been deactivated. (B) The tilt compensation mechanism corrects the predicted solar azimuth using tilting information; the sensor has been tilted 30° NNW (so now the zenith point is 30° SSE); the gating function has changed the focus on the specific ommatidia, as shown in the WSOL ⋅ g matrix. (C) The time compensation mechanism corrects for the solar azimuth changes using the solar elevation; 8 hours have passed so the sun has moved 120° clockwise but the compass is still aligned to the same direction due to the updated WTCL weights (see also the difference in SOL and TCL responses compare to previous steps).

