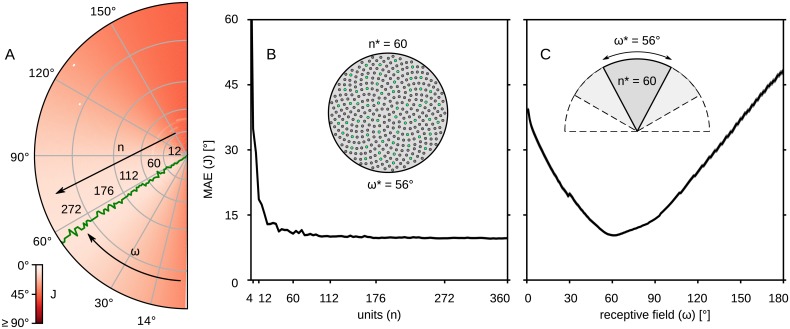
Fig 11. Optimal compass structural parameters.
The performance of the compass for different topological parameters. (A) Values of the objective function on the ω × n plane; red shades illustrate the degree of error; black arrows show the axes; the green line shows the receptive field value associated with the minimum error for different number of units. (B) The error as a function of the number of units, n; the receptive field is fixed at ω = 56°; inset demonstrates the 56° wide sensor with n = 360 units; with green are marked the 60 units closest to the ones we chose. (C) The error as a function of the receptive field, ω; the resolution (ratio between ω and n) is fixed so that the number of units is n = 60 for ω = 56°; inset demonstrates the different visual fields including the optimal one with n = 60 units.

