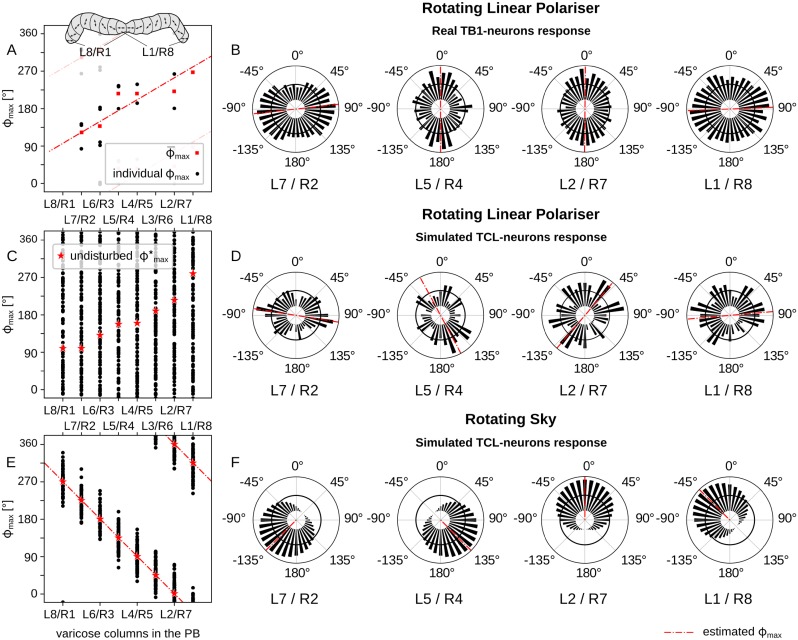
Fig 13. Real and simulated response of compass neurons for artificial and natural polarised light.
E-vector orientation resulting in maximum excitation, ϕmax, for TB1-neurons in different columns of the CX (A,B) and TCL neurons in our simulation, determined by circular statistics (Rayleigh test [55]): (A) Real data of TB1-neurons (N = 15) in the PB of the locust brain, reconstructed from original data supplied by Stanley Heinze after [33] (inset shows the naming of the columns in the PB), (C) simulated TCL-neurons under a rotating linear polariser, and (E) under a rotating natural sky (N = 100, η = 50%, θs = 30°); black dots show individual samples, red squares show the mean ϕmax and red stars show the ϕmax in a condition without external disturbance (η = 0%); red lines are best linear fit to the data points. (B,D,F) show corresponding examples for specific neurons from four of the CX columns; bin width 10°; black solid lines indicate background activity; red lines indicate the ϕmax direction.

