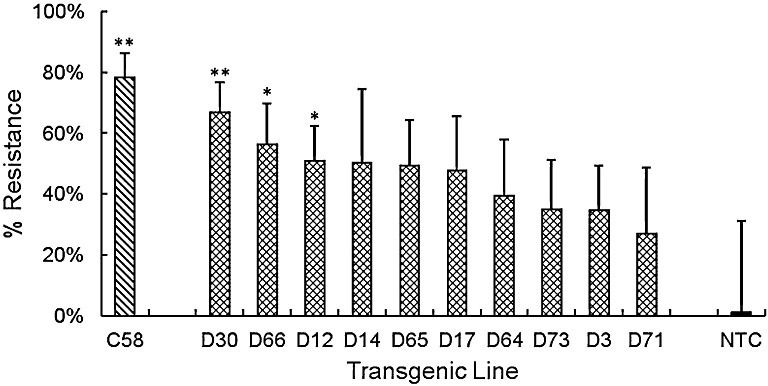
Figure 6.

Resistance of transgenic plantain lines challenged with Radopholus similis. The percentage resistance is presented for lines in the second trial expressing the cystatin (C58) or both anti‐nematode genes. Values are mean nematode numbers ± standard error of the mean per unit weight of roots expressed relative to that for nontransformed Gonja manjaya controls (NTC). One‐way analysis of variance (ANOVA) with a priori contrasts identified those means that differed from the corresponding value for NTC plants (**P < 0.01; *P < 0.05).
