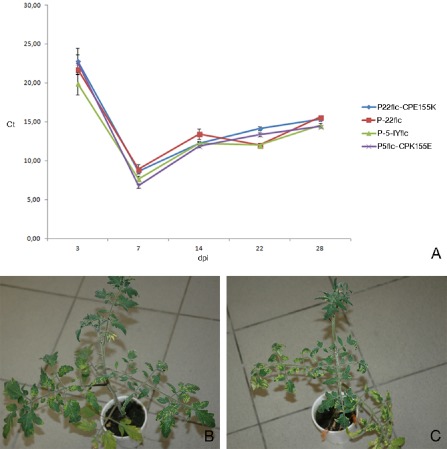
Figure 3.

Study of replicative fitness. (A) Graph showing the Ct values (y axis) obtained using the CH2‐specific TaqMan reverse transcription‐quantitative polymerase chain reaction (RT‐qPCR) assay in tomato plants inoculated with P‐5‐IY flc P‐5flc‐CPK155E, P‐22flc and P‐22flc‐CPE155K and sampled at 3, 7, 14, 22 and 28 days post‐inoculation (dpi; x axis). Each data point represents a mean value of 10 samples from 10 different plants, with error bars representing the standard errors. (B) Tomato plant (Tricia) inoculated with P‐5‐IY flc, displaying yellowing symptoms on the lower leaves and recovery in the head at 40 dpi. (C) Tomato plant (Tricia) inoculated with P‐22flc‐CPE155K, displaying yellowing symptoms on the lower leaves and recovery in the head at 40 dpi.
