
Figure 2.
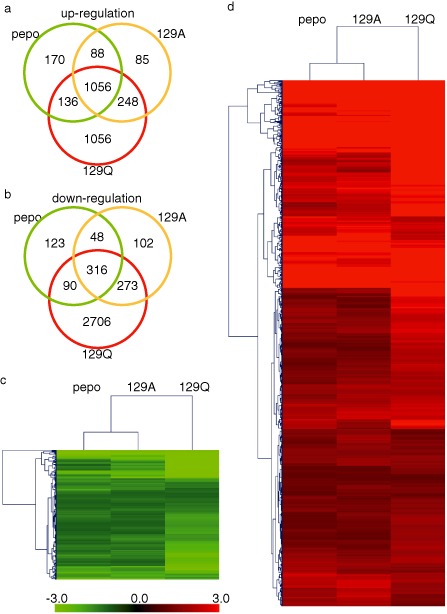
(a, b) Number of specific and common differentially expressed genes (DEGs) among pepo, 129A and 129Q samples. Up‐regulated and down‐regulated DEGS shown in (a) and (b), respectively. (c, d) Hierarchical heat map of up‐regulated (c) and down‐regulated (d) identical DEGs in all three Cucumber mosaic virus (CMV) samples show in (a) and (b), respectively.