
Figure 3.
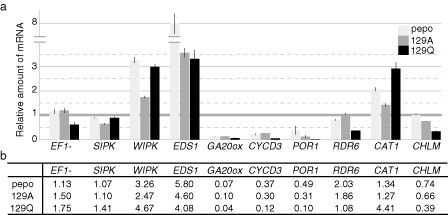
Validation of microarray analysis by quantitative real‐time reverse transcription‐polymerase chain reaction (RT‐qPCR). (a) Relative amounts of representative genes (EF1‐α, SIPK, WIPK, EDS1, CYCD3, GA20ox, POR1, RDR6, CAT1 and CHLM) in the pepo, 129A and 129Q samples analysed by RT‐qPCR. Coloured boxes indicate the relative amount of mRNA of each gene, and the bars on the boxes indicate the standard deviation among three biological replicates. mRNA amounts of each gene in the mock samples are set to unity. Total RNA samples used for the microarray analysis were also used for RT‐qPCR. Serial diluted total RNAs from mock samples were used as standard quantitative controls. A random N6 primer was used for cDNA synthesis. Primers for qPCR are listed in Table S11. (b) Relative amounts of representative genes in pepo, 129A and 129Q samples calculated from the fold changes obtained by microarray analysis.