
Figure 1.
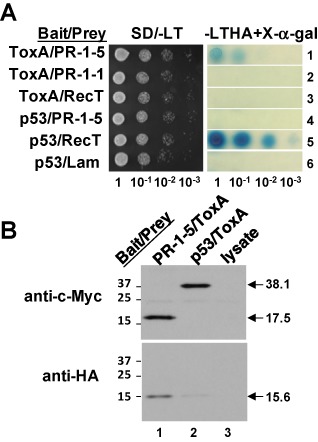
Characterization of the interaction between PR‐1‐5 and ToxA. (A) Yeast two‐hybrid assay. Serially diluted cell suspensions from a single colony of the transformant co‐expressing the bait/prey proteins were inoculated onto selective agar plates and incubated at 30 °C for 36 h. p53/RecT and p53/Lam are standard ‘positive’ and ‘negative’ controls, respectively. Blue coloration on the X‐α‐gal plates reflects the strength of protein–protein interactions. (B) Co‐immunoprecipitation assay. Epitope‐tagged bait and prey proteins were separated by sodium dodecylsulphate‐polyacrylamide gel electrophoresis (SDS‐PAGE) and transferred onto poly(vinylidene difluoride) (PVDF) membrane; the blot was probed first with anti‐c‐Myc antibody (top panel) and then with anti‐haemagglunin (HA) antibody (bottom panel) after stripping. Lane 3 was loaded with a ‘blank’ control. Arrows indicate the respective bait and prey proteins (molecular masses in kDa). The faint band found in the bottom panel (lane 2) was caused by non‐specific binding of the HA tag to the protein G beads. Numbers on the left indicate protein size markers.