
Figure 5.
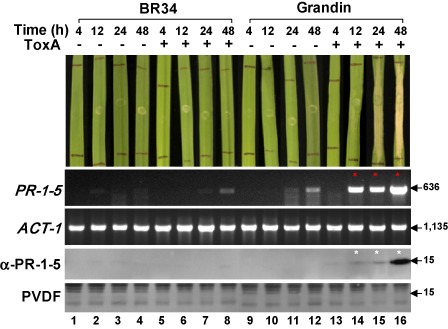
Differential expression of the native PR‐1‐5 protein between ToxA‐insensitive (BR34) and ToxA‐sensitive (Grandin) wheat lines in response to ToxA treatment. Plant assays (top panel): second leaves of 2‐week‐old plants were ‘mock’ infiltrated (−) or infiltrated with ToxA protein (+) at a final concentration of 1.0 ng/μL. Photographs were taken at four time points post‐infiltration as indicated at the top. A representative leaf is shown for each treatment. Reverse transcriptase‐polymerase chain reaction (RT‐PCR) (second and third panels): PCR products were separated on ethidium bromide‐stained 1% agarose gels. Numbers on the right indicate size (in base pairs) of the amplicons. Transcripts up‐regulated relative to those of controls are indicated by red asterisks. ACT‐1, wheat actin gene (internal control). The oligonucleotide sequences of the primers used for RT‐PCR are given in Table S1. Western blot analysis (bottom two panels): protein samples isolated from the plants shown at the top were separated by sodium dodecylsulphate‐polyacrylamide gel electrophoresis (SDS‐PAGE), transferred onto poly(vinylidene difluoride) (PVDF) membrane and probed with the anti‐PR‐1‐5 antibody (α‐PR‐1‐5) (Lu et al., 2013). Signals were detected by exposure to X‐ray films for 30 s. Membranes were stained with Coomassie blue after signal detection (bottom). Numbers on the right indicate the positions of size markers (molecular masses in kDa).