
Figure 3.
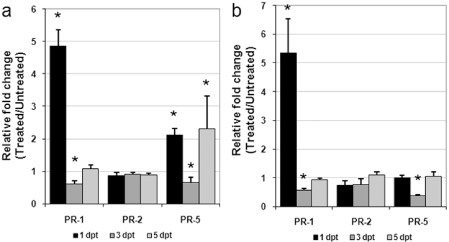
Time course analysis of pathogenesis‐related (PR) gene expression by quantitative real‐time reverse transcription‐polymerase chain reaction (qRT‐PCR) in roots (a) and shoots (b) of susceptible tomato plants at 1, 3 and 5 days post‐treatment (dpt) with salicylic acid (SA). Data are the mean fold changes ± SD in PR transcript levels of tissues from SA‐treated plants relative to those from untreated control plants (the value of unity indicates no change). Means were determined from three biological replicates and three qRT‐PCRs were performed per sample, resulting in a total of nine replicates for statistical analysis. Asterisks indicate that the mean fold change is significantly different from unity as determined by Kolmogorov–Smirnov test (P < 0.05).