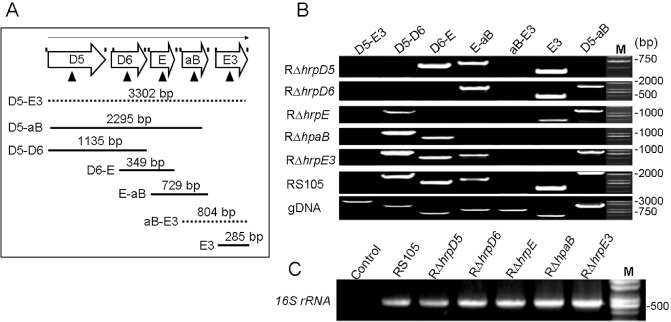
Figure 2.

Reverse transcription‐polymerase chain reaction (RT‐PCR) analysis of transcriptional units in the hrpD5–hrpE3 region of Xanthomonas oryzae pv. oryzicola (Xoc). (A) Schematic representation of the hrpD5–hrpE3 region; RT‐PCR primers are indicated by vertical lines above the open arrows and were designed to span the intergenic junctions. Triangular arrows present the open reading frame (ORF)‐deleted mutations in the region from hrpD5 to hrpE3. The open arrows represent hrpD5 (D5), hrpD6 (D6), hrpE (E), hpaB (aB) and hrpE3 (E3). The full lines indicate the physical map location of PCR products amplified in this experiment; the dotted lines represent the deletions in PCR products D5‐E3 and aB‐E3. D5‐E3 denotes PCRs with the primer pair hrpD5F‐hrpE3R, D5‐aB with hrpD5F‐hpaBR, D5‐D6 with hrpD5F‐hrpD6R, D6‐E with hrpD6F‐hrpER, E‐aB with hrpEF‐hpaBR, aB‐E3 with hpaBF‐hrpE3R and E3 with hrpE3F‐hrpE3R. (B) Transcripts detected by RT‐PCR using cDNA isolated from RS105, RΔhrpD5, RΔhrpD6, RΔhrpE, RΔhpaB and RΔhrpE3; bacterial strains were incubated in the hrp (hypersensitive response and pathogenicity)‐inducing medium XOM3 for 16 h. (C) The 16S rRNA gene was used to verify the absence of significant variation in cDNA levels. Lane M represents a molecular weight marker (TaKaRa). All experiments were repeated three times, and similar results were obtained each time.
