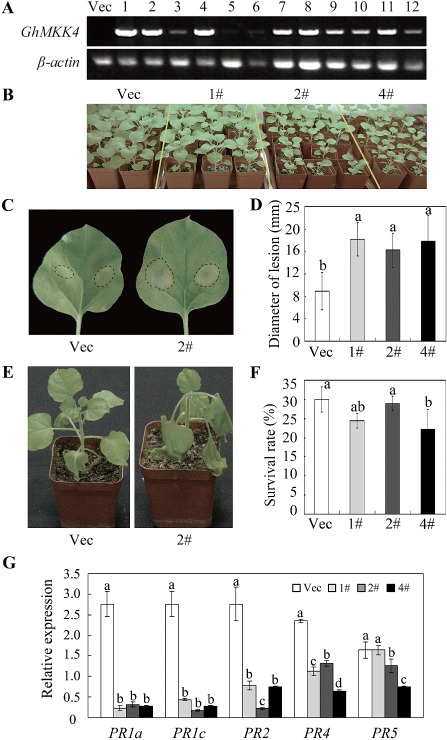
Figure 4.

Identification of transgenic plants and subsequent bacterial pathogen resistance analysis. (A) The evaluation of GhMKK4 expression in the T1 progeny of transgenic plants. (B) The developmental phenotype of the transgenic plants. The photograph was taken approximately 6 weeks after the seedlings had been transplanted into the tubs. (C) The symptoms of detached leaves from 2‐month‐old T3 generation transgenic plants at 4 days after Ralstonia solanacearum injection. The lesion diameters are indicated in (D). Different letters above the columns indicate significant differences (P < 0.05) according to Duncan's multiple range test. (E) The phenotypes of the transgenic plants after inoculation with R. solanacearum using the trickle irrigation method. The survival rates of these plants are shown in (F). (G) The expression of the pathogenesis‐related (PR) genes in transgenic plants as analysed by quantitative real‐time polymerase chain reaction (qPCR). Different letters above the columns indicate significant differences (P < 0.05) according to Duncan's multiple range test. Each experiment was repeated at least three times. Vec, vector control; 1#, 2#, 4#, overexpressing lines.
