
Figure 6.
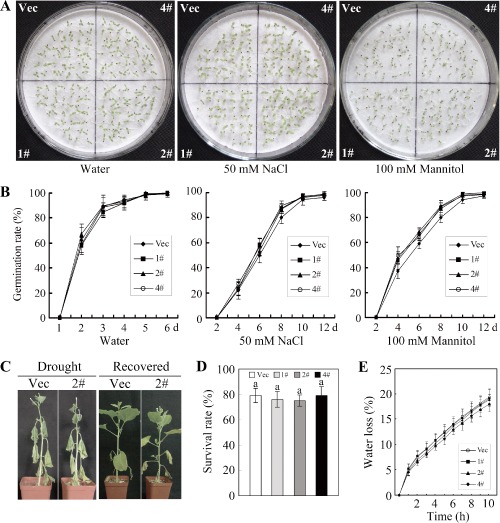
Tolerance analysis of transgenic plants to salt and drought stresses. (A) The seed germination phenotype. The seeds were germinated on filter paper soaked with 50 mm NaCl or 100 mm mannitol. The photographs shown were taken approximately 14 days after the seeds had been sown. (B) The germination rates of the seeds under normal and stress conditions. Germination was scored daily, and the results of germination on filter paper soaked with 50 mm NaCl or 100 mm mannitol are presented. (C) The phenotypes of plants subjected to drought stress at the late vegetable stage. Water was withheld from transgenic plants for 12 days, and the plants were then watered for 2 days to allow recovery. (D) The survival rates of the transgenic plants under drought conditions. The data shown represent the means ± standard errors of three independent experiments (n ≥ 30). (E) The water loss of detached leaves from the OE and Vec plants. The rates of water loss were calculated by the loss in fresh weight of the samples. The data shown represent the means ± standard errors of three independent experiments (n = 6). OE, overexpressing; Vec, vector control; 1#, 2#, 4#, overexpressing lines.