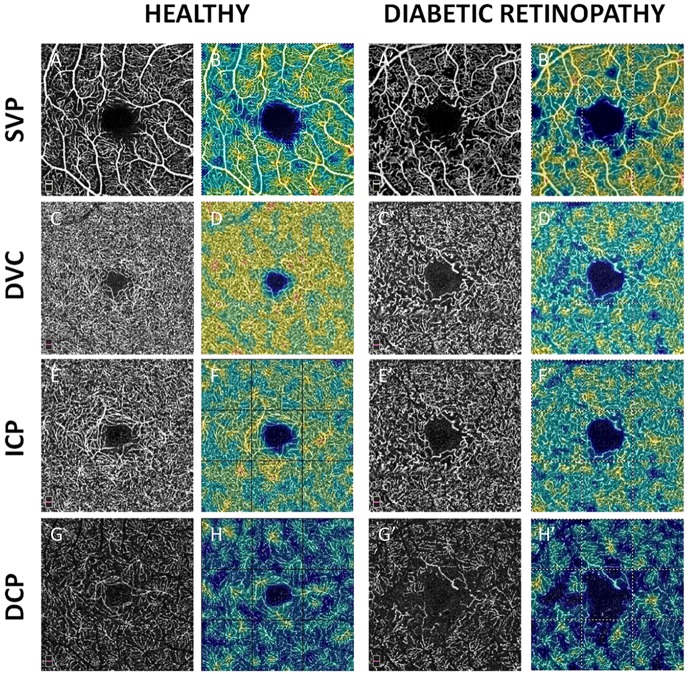
Fig 1. En-face OCTA angiograms of a healthy subject (left columns, A to H) and a T1D patient with severe NPDR (right columns, A’ to H’).
Black and white scans (A, C, E, and G) represent OCTA angiograms. Color map scans (B, D, F, and H) represent color-coded VD in the corresponding OCTA angiograms. Warmer colors represent higher VD. A-A’ and B-B’: Superficial vascular plexus (SVP). C-C’ and D-D’: Deep vascular complex (DVC). E-E’ and F-F’: Intermediate capillary plexus (ICP). G-G’ and H-H’: deep capillary plexus (DCP). A rarefaction of the capillary meshwork on all OCTA angiograms was observed in the eye with severe NPDR compared to the healthy eye.

