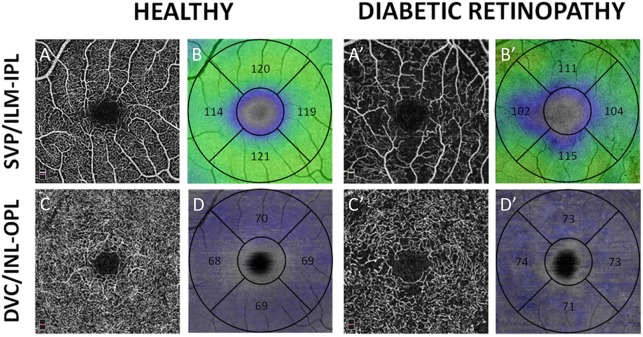
Fig 4. En-face OCTA angiograms (black and white) and retinal thickness maps (color-coded maps) of a healthy subject (left columns, A to D) and a T1D patient (right columns, A’ to D’).
A-A’: OCTA angiograms of the superficial vascular plexus (SVP); B-B’: color-coded maps of the inner retinal thickness (from the inner limiting membrane, ILM, to the border between the inner plexiform layer, IPL, and the inner nuclear layer, INL). C-C’: OCTA angiograms of the deep vascular complex (DVC); D-D’: color-coded maps of the intermediate retinal thickness (including the INL and the outer plexiform layer). Thickness values in micron are reported from each quadrant of the parafoveal area within the color-coded maps.

