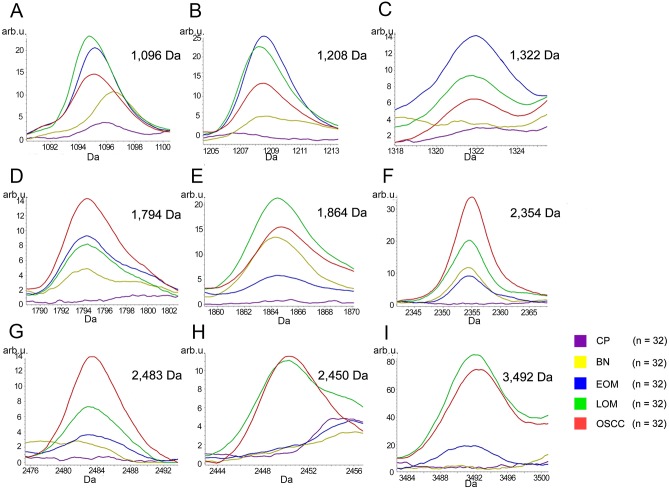
Fig 3. MALDI-TOF intensity profiles of salivary proteins from benign tumors (BN), early-stage oral melanoma (EOM), late-stage OM (LOM) and oral squamous cell carcinoma (OSCC).
Percentages of interpretable mass signals are shown: SENP7 or KAT2B at 1096 Da (A); PPRC1 or RMND1 at 1208 Da (B); DTX3L at 1322 Da (C); ZNF699 at 1794 Da (D); MAP3K15 or ATP6V1E2 at 1864 Da (E); PLCL2 at 2354 Da (F); COL12A1 at 2483 Da (G); TNRC18 at 2450 Da (H); TLR4 at 3492 Da (I). arb. u., arbitrary unit.

