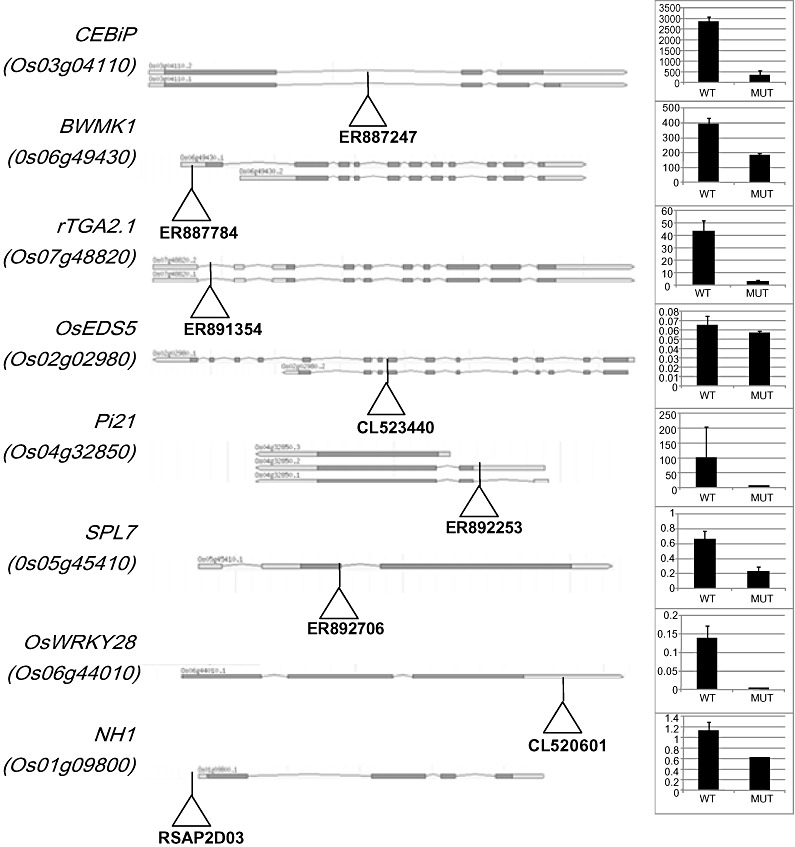
Figure 2.

Genomic structure and transcript levels in the insertion mutants for eight disease regulators. Left: the different splice forms for each gene, together with the position of the T‐DNA insertion site. The primers used to genotype the plants are shown in Table S2. Right: transcript levels for the corresponding gene, as measured by reverse transcription‐quantitative polymerase chain reaction, in mutant plants (MUT) compared with the corresponding null segregant plants (WT), 2 days after infection. The mean and standard deviation of four independent biological replicates, expressed in arbitrary units, are shown.
