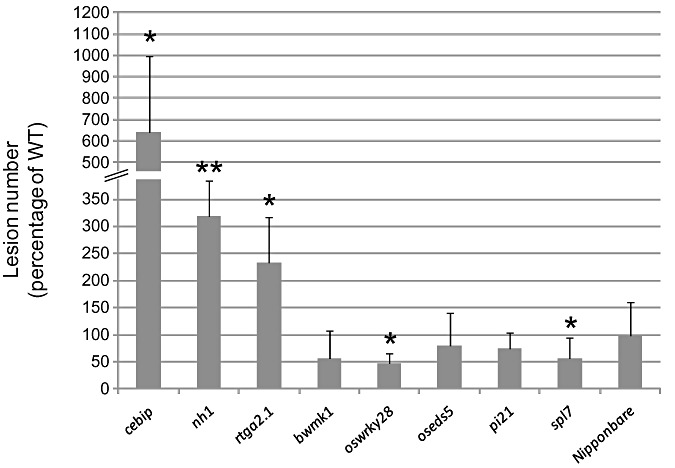
Figure 4.

Quantitative effect on blast resistance of the mutations in disease regulators. The total number of lesions was counted for each leaf after infection by the virulent isolate GY11 of Magnaporthe oryzae. For each mutant line, the average number of lesions over more than eight plants was calculated for the corresponding null segregant line. This value was used to calculate the percentage of lesions per individual mutant plant relative to the mean of the null segregant plants (WT). The mean and standard deviation were then calculated. This experiment was repeated three times and one representative experiment is shown. A t‐test was performed to establish whether one given mutant line was different from its corresponding null segregant line (*P < 0.05; **P < 0.001).
