
Figure 1.
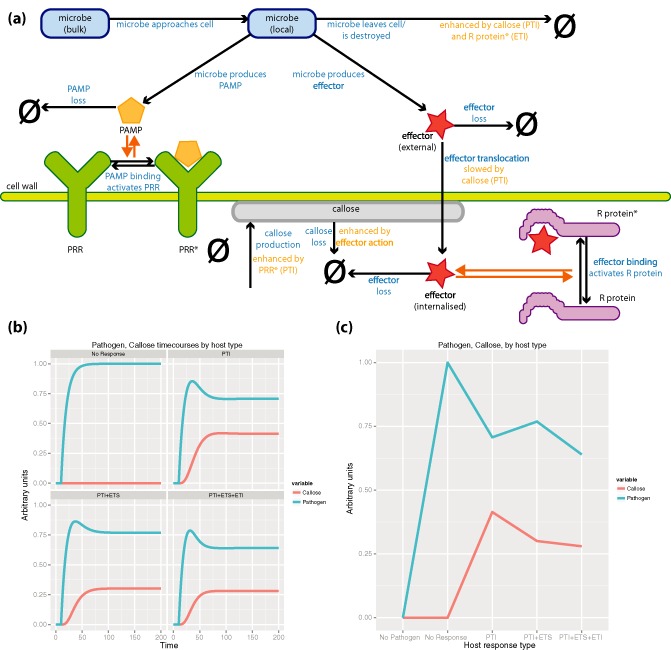
(a) Schematic diagram of the model plant immune system (BioModels: MODEL1408280000). The system is divided into two ‘compartments’: extracellular (external to the cell wall) and intracellular (internal to the cell wall). In the extracellular compartment the local microbial population is drawn from a remote bulk population and is also ‘destroyed’, as indicated by the arrow pointing to the empty set symbol (ϕ). The rate at which the microbe is ‘destroyed’, which may be interpreted, for example, as microbial movement or death, is enhanced by pattern‐triggered immunity (PTI) and effector‐triggered immunity (ETI). While local to the plant, the microbe produces two species: pathogen‐associated molecular patterns (PAMP) and effector; both species can be lost (e.g. by diffusion or destruction) in the extracellular compartment. The PAMP may interact reversibly with plant pattern‐recognition receptor (PRR) to produce an activated PRR* species. The effector may be internalized to the cell (translocation), where it may interact reversibly with plant R protein to produce an activated R protein* species. Within the cell compartment, if there is activated PRR*, the plant also produces callose, as a proxy for PTI activity. This is degraded within the plant cell. As a proxy for PTI, callose also increases the rate at which local microbe populations decline, and acts to reduce the rate at which effector is translocated into the cell. Activated R protein* also increases the rate at which the local microbial population is depleted, as an abstraction of ETI. (b), (c) Quantitative output of the immune system model. (b) Levels of callose and pathogen (arbitrary units) over 200 time units of simulation, for systems where the host shows: no resistance response: PTI, host shows PTI only; PTI+ETS, host shows PTI only but the pathogen suppresses PTI by effector production; PTI+ETS+ETI, host exhibits PTI and ETI, but the pathogen suppresses PTI by effector production. (c) Levels of callose and pathogen (arbitrary units) after 200 time units, when a steady state has been reached, demonstrating the influence of PTI, ETI and effector action with respect to the absence of a host immune response. The profile of steady‐state pathogen levels resembles the profile of the expository zigzag model.