
Figure 4.
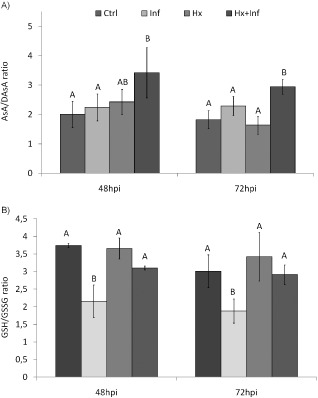
Ascorbate and glutathione levels in the untreated non‐infected plants (Ctrl), untreated and Botrytis‐infected plants (Inf), hexanoic acid (Hx)‐treated and non‐infected plants (Hx), and Hx‐treated and infected plants (Hx+Inf) at 48 and 72 h post‐inoculation (hpi). (A) Reduced ascorbate (AsA) and oxidized dehydroascorbate (DAsA) ratios. (B) Reduced (GSH) and oxidized (GSSG) glutathione ratios. The data shown are the means of three independent experiments ± standard deviation (SD). Different letters indicate Student's t‐test significant differences at the 95% confidence level.