
Figure 4.
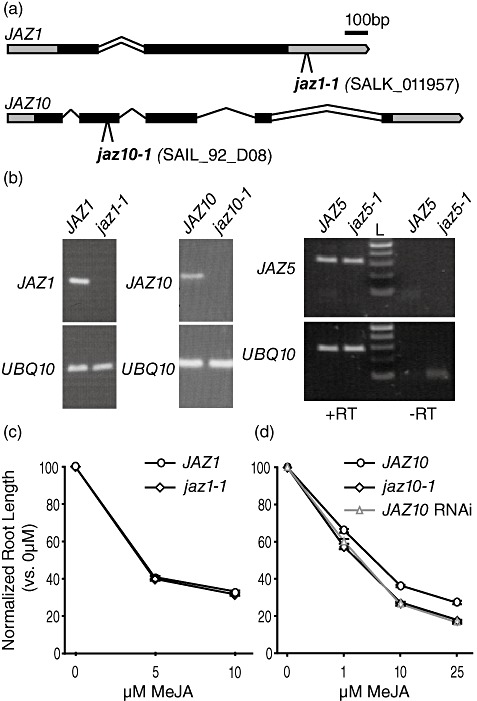
Characterization of jaz1, jaz5 and jaz10 mutants. (a) Schematic diagrams of the JAZ1 (At1g19180) and JAZ10 (At5g13220) loci. Bars represent exons with untranslated regions in grey. Lines represent introns, with double lines indicating introns that are retained in some splice variants. The T‐DNA insertion in jaz1‐1 is approximately 80 bp downstream of the end of the translated region of the gene. The T‐DNA insertion in jaz10‐1 is located 20 bp from the 3′ end of the second exon. (b) Reverse transcription‐polymerase chain reaction (RT‐PCR) of the indicated transcripts in wild‐type and jaz mutant plants. Transcript levels were monitored in seedlings after 10 days of growth on 10 µm methyl jasmonate (MeJA). UBQ10 (At4g05320) was used as an internal control. For JAZ5, a minus reverse transcriptase (–RT) control was included to demonstrate that the PCR product corresponds to JAZ5 transcript, not genomic DNA. (c) Jasmonate (JA) root growth inhibition assay of wild‐type (circles) and jaz1‐1 (diamonds) seedlings using 0, 5 and 10 µm MeJA. The normalized root length of at least 34 plants per treatment was calculated as a percentage of the average root length of plants grown without MeJA. Error bars represent ±SE. Experiments were performed three times with similar results. (d) JA root growth inhibition assay of wild‐type (circles), jaz10‐1 (diamonds) and JAZ10 RNAi (triangles) seedlings at increasing concentrations of MeJA. The normalized root length of at least 28 plants was calculated as described in (c).