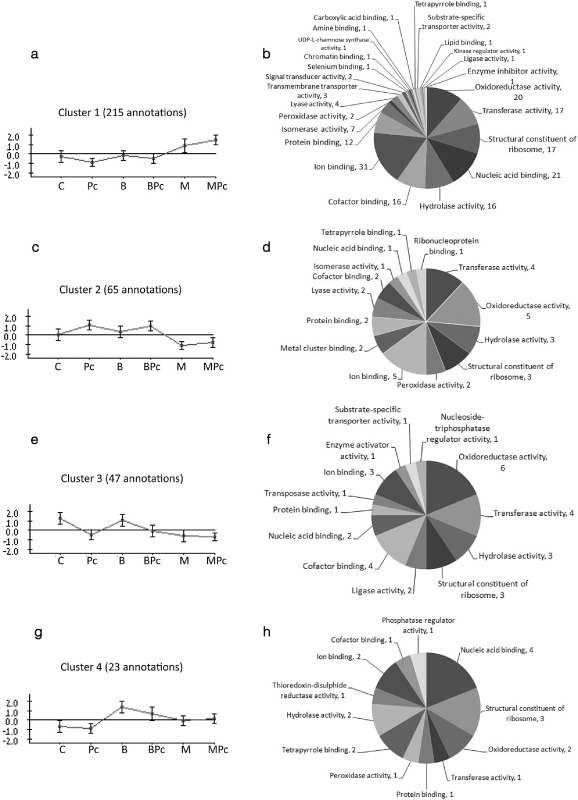
Figure 3.

Clusters of leaf proteins expressed in the different treatments: C, distilled deionized water (ddw); B, benzothiadiazole (BTH; 5 μg/mL); M, methyl jasmonate (MJ; 10 mg/mL); Pc, Pectobacterium carotovorum; BPc, BTH + P. carotovorum; MPc, MJ + P. carotovorum. The pie charts on the right show the number of proteins in different functional classes [Gene Ontology (GO) level 3]. The CLICK (CLuster Identification via Connectivity Kernels) algorithm was used to cluster the annotated proteins on the basis of their expression levels. (a, b) Cluster 1. (c, d) Cluster 2. (e, f) Cluster 3. (g, h) Cluster 4.
