
Figure 1.
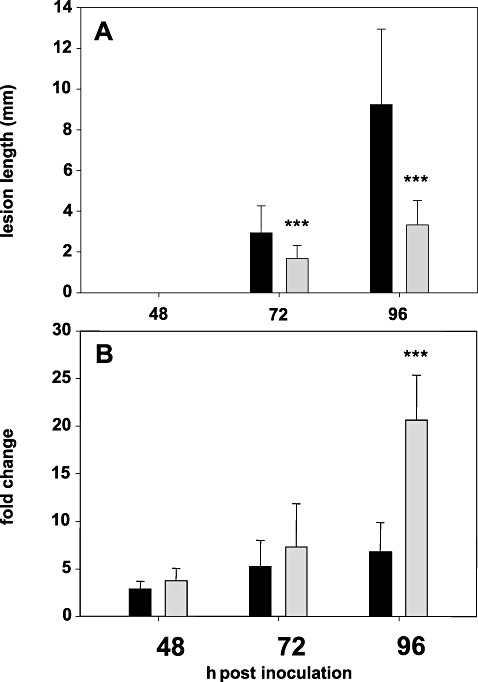
Lesion development and CsCCR2 gene expression in Camelina sativa lines 36011 (grey bars) and 36012 (black bars) at 48–96 h post‐inoculation (hpi). (A) Lesion development. (B) Changes in transcript level relative to mock‐inoculated plants. Columns and bars represent the means and standard deviations of four biological replicates. Asterisks denote a significant difference at P≤ 0.01.