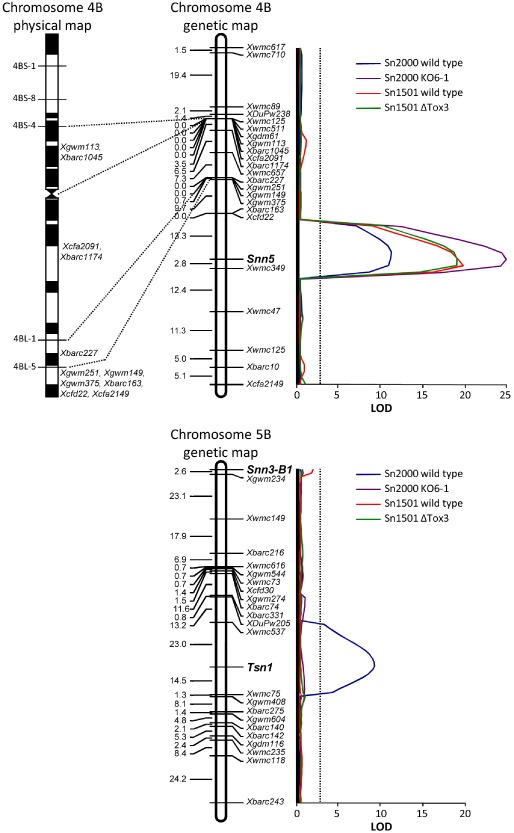
Figure 3.

Genetic mapping and interval regression analysis of the Snn5, Tsn1 and Snn3–B1 loci. Genetic linkage maps of chromosomes 4B and 5B developed in the LP749 population are in the middle. Marker loci are shown along the right of the maps and centiMorgan distances along the left. The Snn5, Tsn1 and Snn3–B1 loci are indicated in bold. The deletion‐based physical map of chromosome 4B (Sourdille et al., 2004) is shown to the left of the 4B linkage map. Comparisons of common markers demonstrate that the Snn5 locus is distal to the 4BL‐5 breakpoint and therefore lies in the distal 15% of the chromosome arm. Results of the interval regression analysis using SNB data obtained from inoculation of the LP749 population with Stagonospora nodorum isolates Sn2000 (SnToxA + SnTox5), Sn2000KO6‐1 (SnTox5), Sn1501 (SnTox3 + SnTox5) and Sn1501ΔTox3 (SnTox5) are shown to the right of the linkage maps. Logarithm of the odds (LOD) values are plotted along the x axis and the significance threshold of 3.1 is indicated by the dotted line.
