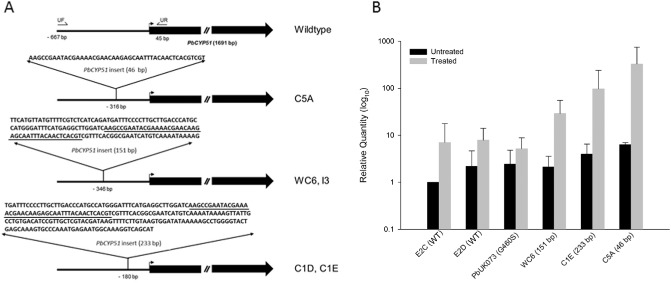
Figure 2.

(A) Schematic diagram of PbCYP51 upstream insertions. UF indicates the position of primer CYP51upstreamF and UR indicates the position of primer CYP51upstreamR. Underlining indicates the location of the 46‐bp duplicated sequence within the 151 and 233‐bp inserts. Arrow indicates translation start site. (B) Expression of PbCYP51 in Pyrenopeziza brassicae isolates measured as the mean relative quantity compared with the sample E2C (untreated). Error bars denote 95% confidence level. PbCYP51 genotypes are given in parentheses.
