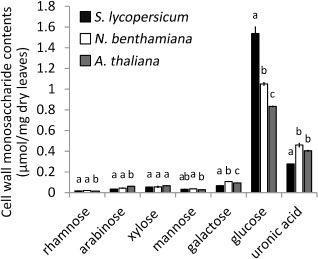
Figure 1.

Cell wall monosaccharide contents of leaves of Solanum lycopersicum, Nicotiana benthamiana and Arabidopsis thaliana. The monosaccharides analysed are given underneath the columns. Contents are given in μmol/mg dry weight. Bars indicate means ± standard deviation. For each monosaccharide, the letters above the bars indicate statistical significance; bars not sharing letters represent significant mean differences at P < 0.05 by Student's t‐test.
