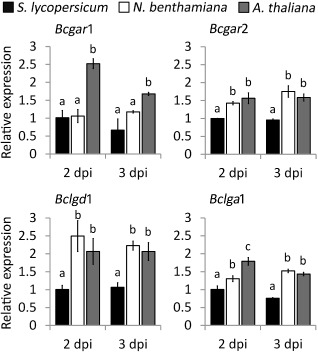
Figure 2.

Relative transcript levels of d‐galacturonic acid catabolic genes during infection on Solanum lycopersicum, Nicotiana benthamiana and Arabidopsis thaliana. Infected plants were sampled at 2 and 3 days post‐inoculation (dpi) for RNA extraction. mRNA levels of d‐galacturonic acid catabolic genes were normalized to the levels of the constitutive reference gene Bcrpl5 and calibrated to the levels on S. lycopersicum at time point 2 dpi (set as 1), according to the 2–ΔΔCt method. Data are represented as means ± standard deviation from one biological repeat. Three technical replicates of each repeat were analysed and three independent biological repeats were performed, all with similar results. For each time point, letters above the bars indicate statistical significance; bars not sharing letters represent significant mean differences at P < 0.05 by Student's t‐test.
