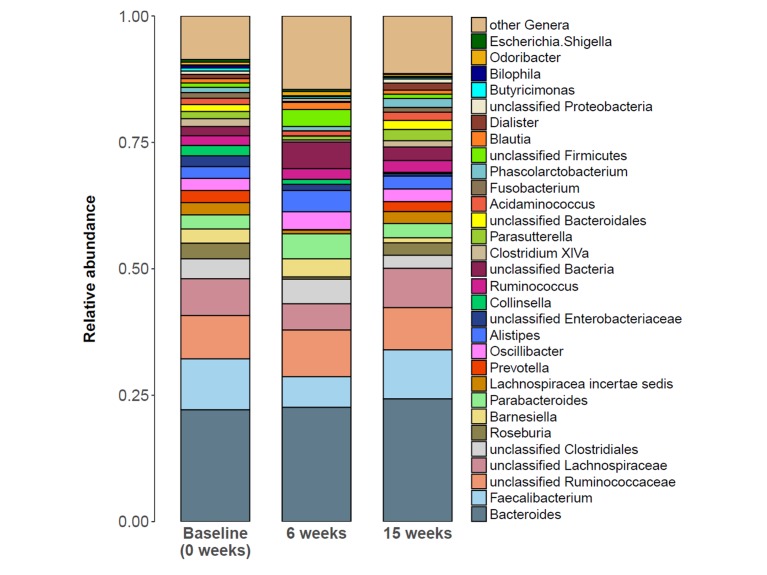
Fig 4. Taxon composition at baseline, 6 and 15 weeks after study launch.
Stacked bar plots portraying the average sample composition of the study group (n = 12) at baseline/0 weeks, after six weeks of low-calorie formula diet and after regular food reintroduction at fifteen weeks. Taxon abundance changes were most prominent at six weeks, but mostly not sustained at fifteen weeks.

