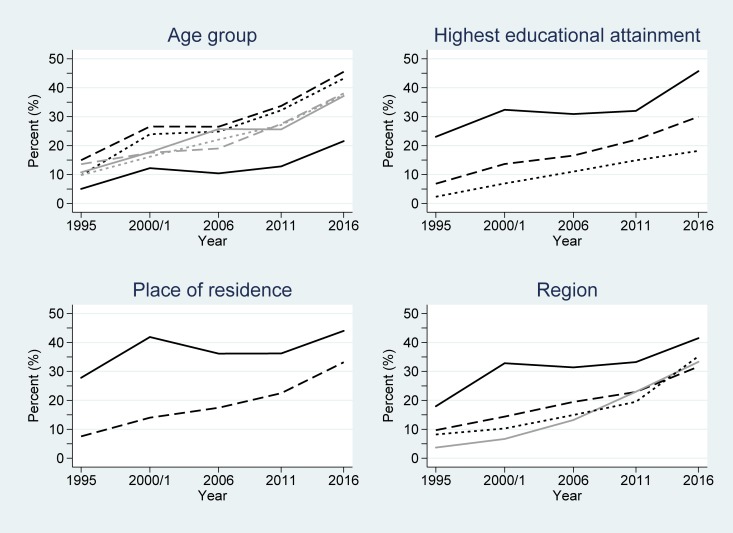
Fig 5. Changes in modern contraceptive use among men in Uganda across the study period (1995–2016).
Key: age group (years): 15–19 (black/solid); 20–24 (black/dash); 25–29 (black/dot); 30–34 (grey/solid); 35–39 (grey/dash); ≥40 (grey/dot); highest educational attainment: secondary and higher (solid); primary (dash); none (dot); place of residence: urban (solid); rural (dash); and region: Central (black/solid); East (dash); West (dot); North (grey/solid).

