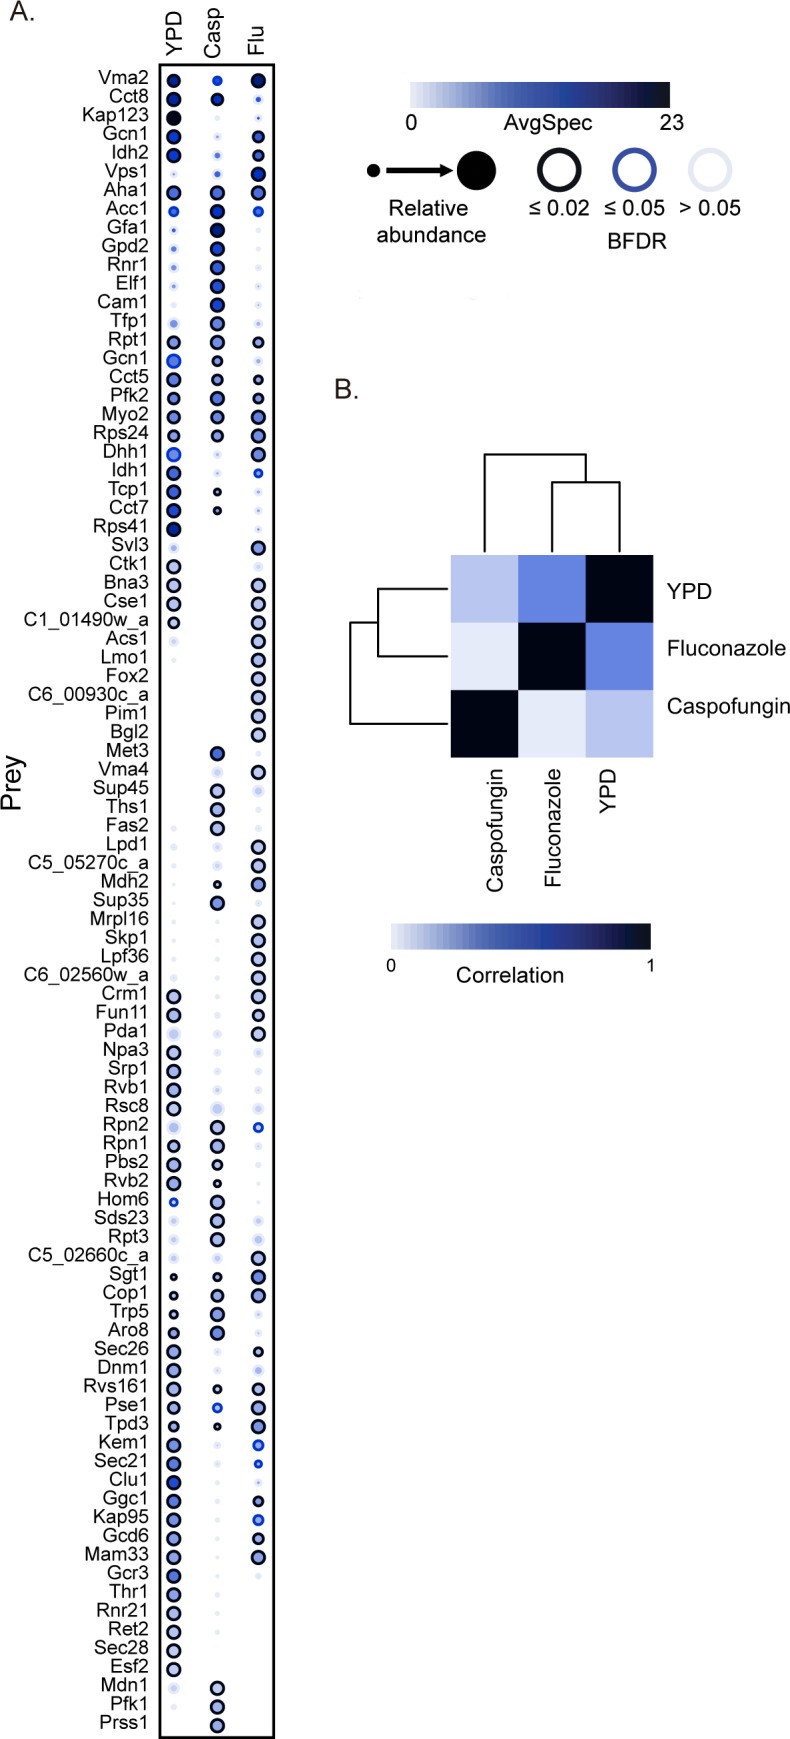
Fig 3. The Hsp90 physical interaction network is modulated by antifungal drug stress.

(A) AP-MS was performed on HSP90E36A-GFP/HSP90 cells grown at 30°C in the presence or absence of 8 μg/mL fluconazole (Flu) or 100 nM caspofungin (Casp). Statistically significant Hsp90 interaction partners are shown as a dot plot in which node color represents the absolute number of spectral counts, node size represents relative abundance between samples, and node edges represent the SAINTexpress BFDR rate at which a given prey protein was observed. Raw data for this figure can be found in S4 Table. (B) Bait versus bait comparison shows the highest correlation is between interactors identified in the YPD and fluconazole conditions. Color scale represents the degree of correlation. AP-MS, affinity purification-mass spectrometry; AvgSpec, Average Spectral Count; BFDR, Bayesian false discovery rate; GFP, green fluorescent protein; SAINTexpress, Significance Analysis of INTeractome.
