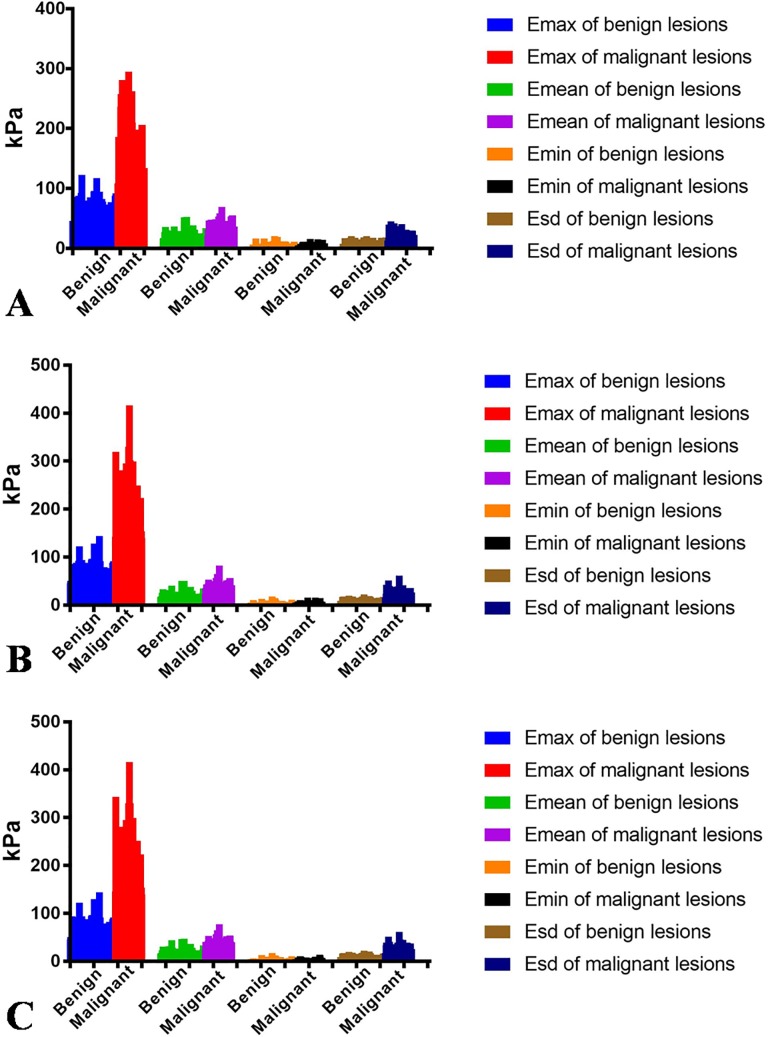
Fig 3.
Distribution of Emax, Emean, Emin, and Esd between benign and malignant breast lesions (A, Distribution of Emax, Emean, Emin, and Esd when the “shell” was 1mm. B, Distribution of Emax, Emean, Emin, and Esd when the “shell” was 2mm. C, Distribution of Emax, Emean, Emin, and Esd when the “shell” was 3mm.).

