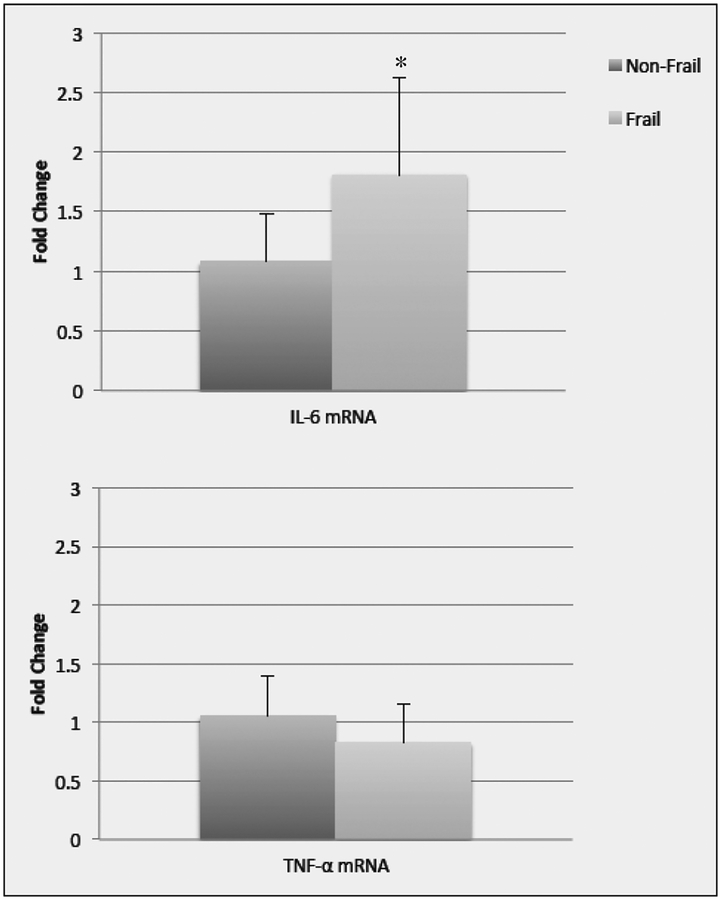
Figure 2a.
Data (mean +/− SE) represents the fold change in mRNA for IL-6 and TNF-α in non-frail and frail older adults. *significant difference (p=0.02) between non-frail and frail older adults. Note: 11 non-frail and 7 frail older adults were included in the analysis except for IL-6 mRNA where one frail older adult was out of detectable range (>40 cycle threshold)

