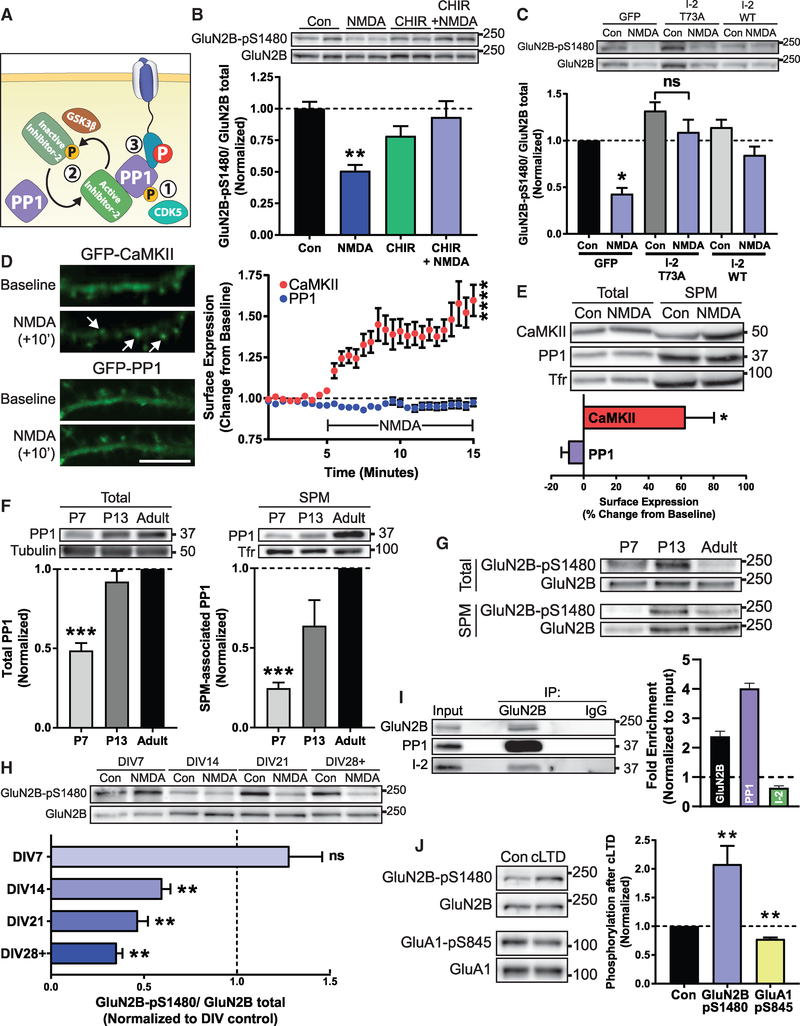
Figure 3. Regulation of the PP1-Dependent Dephosphorylation of GluN2B S1480.
All graphs represent mean ± SEM; *p < 0.05; **p < 0.01; ***p < 0.001; ****p < 0.0001 in a Kruskal-Wallis H test (B, C, and F) or a Mann-Whitney U test (D, E, H, and J).
(A) PP1 is regulated by (1) inhibitory CDK5 phosphorylation, (2) complexing with endogenous inhibitor proteins, or (3) targeting to a correct substrate.
(B) Immunoblot analysis of GluN2B-pS1480 levels from DIV14 cortical primary neurons after pharmacological blockade of GSK3 to prevent I-2 inactivation (CHIR99021; 10 μM for 2 h) prior to NMDA-triggered dephosphorylation of GluN2B-pS1480. n = 8.
(C) GluN2B-pS1480 levels were assessed by immunoblotting from DIV14-DIV17 cortical primary neurons after lentiviral transduction of constitutively active GFP-I-2 (I-2 T73A) or GFP and GFP-I-2 WT(as controls) in cortical neurons for 7–10 days. GluN2B-pS1480 dephosphorylation was induced with NMDA as before. p = 0.63 (I-2 T73A). n = 6.
(D) NMDA-induced translocation to the plasma membrane of GFP-PP1 and GFP-CaMKII (as a control) was evaluated in DIV14 hippocampal cultures by TIRF microscopy. Baseline fluorescence was recorded for 5 min prior to the addition of 50 μM NMDA. Graph represents changes in TIRF signal over time. Scale bar represents 10 μm. n = 11 in 4 independent experiments. See also Videos S1 and S2.
(E) The SPM fraction of DIV14-DIV21 cortical neurons was isolated and the relative expression of the indicated proteins was evaluated by immunoblotting. Protein levels were normalized to transferrin receptor (Tfr) in each condition and then normalized to control surface expression levels. n = 4.
(F) Levels of PP1 present in the SPM fraction of mice of the indicated age were assessed by immunoblotting. n = 8.
(G) Levels of GluN2B-pS1480 present in the SPM fraction of mice of the indicated age were assessed by immunoblotting.
(H) Immunoblot analysis of GluN2B-pS1480 from cortical primary neurons of different DIVs after induction of GluN2B-pS1480 dephosphorylation. p = 0.68 (DIV7). n = 5.
(I) The extrasynaptic fraction from rat cortex was isolated and the association of GluN2B, PP1, and I-2 was analyzed by immunoblotting following co-immunoprecipitation with an anti-GluN2B antibody. Graph represents fold of enrichment normalized to input. n = 3.
(J) cLTD (20 μM NMDA for 3 min and 30 min recovery) was initiated in acute hippocampal slices from P72-P84 mice. GluN2B-pS1480 and GluA1-pS845 levels were assessed by immunoblotting. n = 6.
See also Figure S3.

