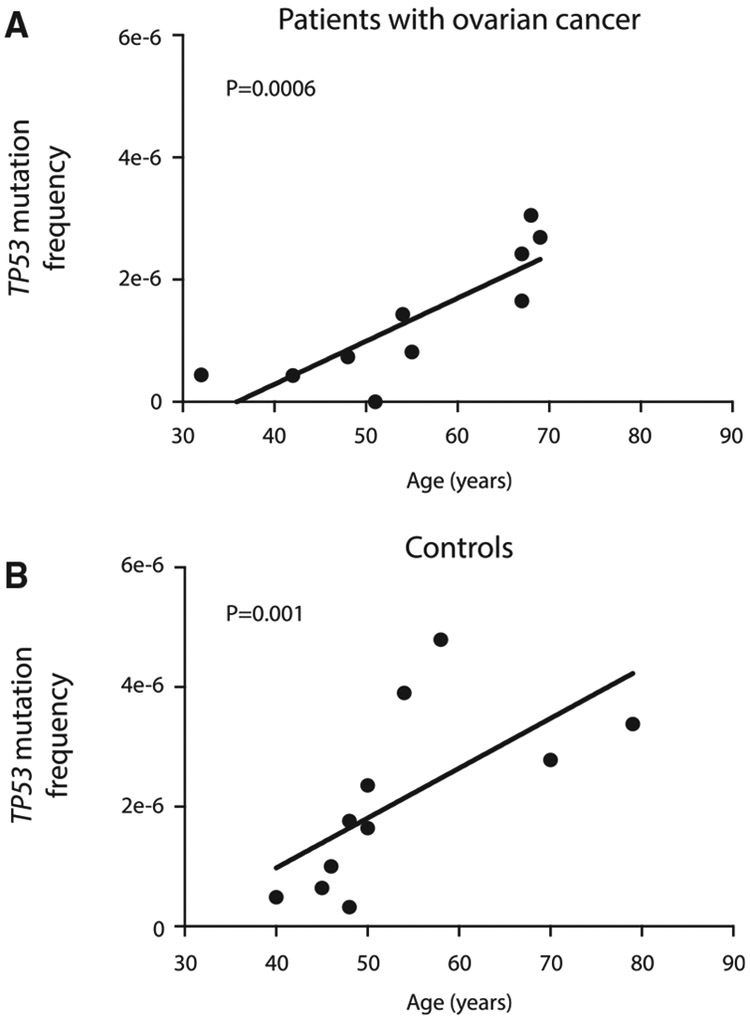
Figure 2. The Frequency of TP53 Mutations in UL Increases with Age.
Frequency is calculated as the total number of unique TP53 mutations identified in each sample (including exons and flanking intronic regions) divided by the total number of DS nucleotides sequenced.
(A) UL samples from patients with ovarian cancer; n = 10, r = 0.89, p = 0.0006 by Spearman’s correlation test.
(B) UL samples from control patients without cancer; n = 11, r = 0.83, p = 0.001 by Spearman’s correlation test.

