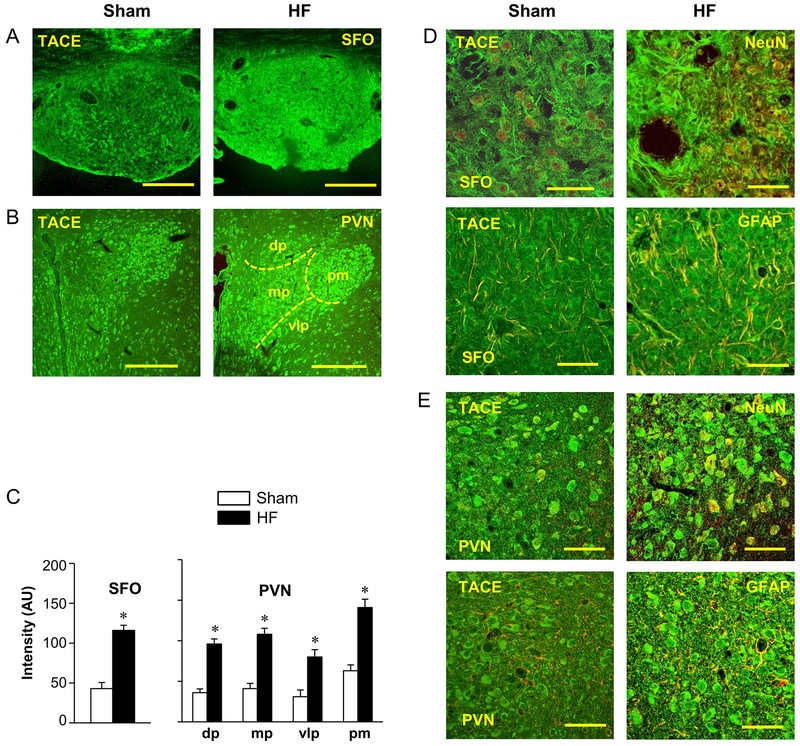
Figure 1.
Laser confocal images showing expression of TNF-α converting enzyme (TACE, green) in (A) subfornical organ (SFO) and (B) hypothalamic paraventricular nucleus (PVN) of sham-operated (Sham) and heart failure (HF) rats. Rough boundaries of the four subdivisions of the PVN are indicated. dp: dorsal parvocellular subdivision of PVN; mp: medial parvocellular subdivision of PVN; vlp: ventrolateral parvocellular subdivision of PVN; pm: posterior magnocellular subdivision of PVN. Scale bar: 200 μm. (C) Quantification of TACE immunoreactivity in SFO and PVN in Sham and HF rats. Values in arbitrary units (AU) are expressed as mean ± SEM. * p<0.05, compared to Sham rats (n=6 in each group). (D, E) High power images showing the co-localized expression (merged: yellow) of TACE (green) with NeuN (left, red) and the astrocyte marker GFAP (right, red) in SFO (D) and PVN (E) in a HF rat. Scale bar: 50 μm.

